
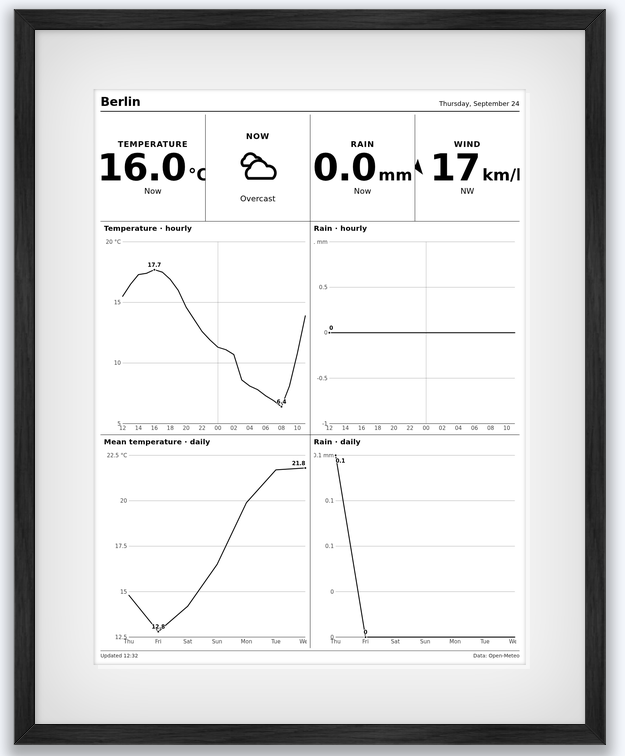
I check the weather several times a day, especially when I going outside and try to decide what to wear. So I always struggle with the question does it rain, do I need an umbrella? That means unlocking my phone, opening an app and often ending up somewhere else entirely. An E-Paper frame on the wall gives me the same information at a glance, and the display draws almost no power between updates.
I couldn't find an integration that showed the weather the way I wanted on my Paperlesspaper frame, so I wrote one. As I described in my post More Than Just Code, I like to fix problems I run into myself. The result is an new open source integration that turns your picture frame into a configurable weather station.
What is Paperlesspaper OpenPaper?
Paperlesspaper makes E-Paper picture frame. I got my hands on one of the first batches of the new OpenPaper L from Paperlesspaper and immediately tried out all possibilities. Besides photos, the frames can show content from Open Integration: small web services that the Paperlesspaper app calls to render an image for your device. This means everything you want to be shown on your display is up to you. There is no limitation. You can build and host your own integration, and this project is one of them.
What the integration does
The integration pulls weather data from Open-Meteo, a free weather API that works without an API key. You don't have to register anywhere or manage credentials. It supports multiple weather metrics and models all around the world.
You can display two kinds of weather data:
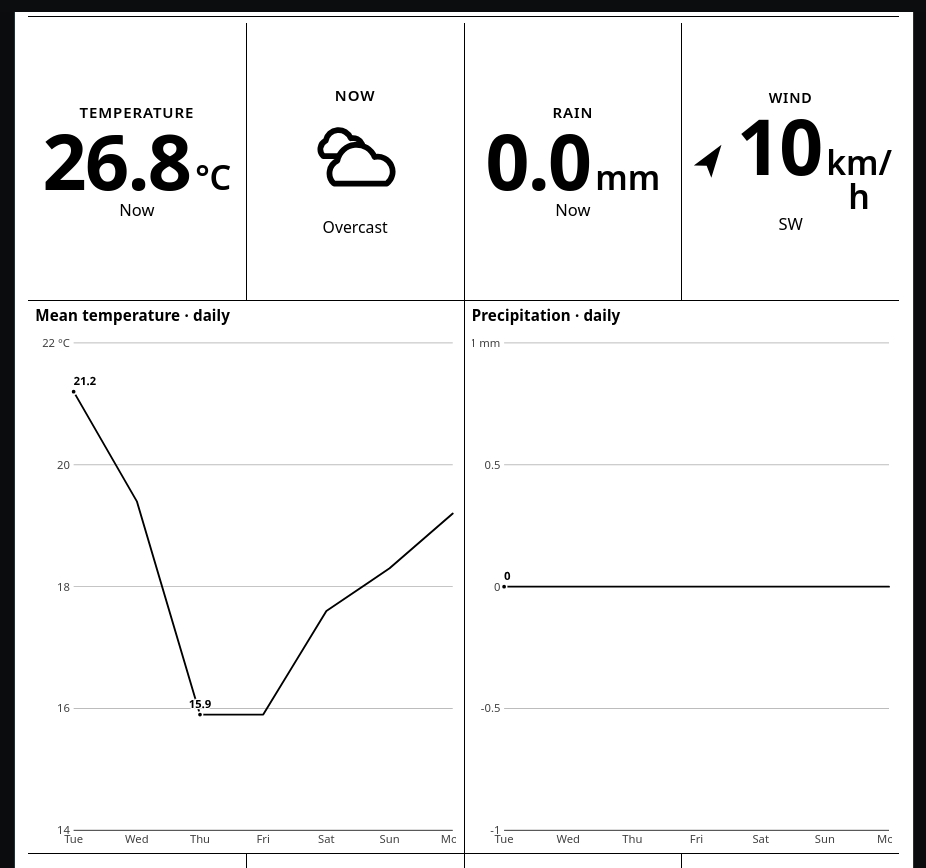
- current weather data: such as temperature, humidity or wind speed, shown as large tiles
- forecast weather data: in 15-minute, hourly or daily resolution, shown as charts
There is also special tiles for a weather icon, the location, sunrise and sunset, and the daily temperature range as min and max values.. You place all of them on a grid with a custom layout of your choice.
What you need
- A Paperlesspaper OpenPaper frame
- An account for the Paperlesspaper web app
- A server that is publicly reachable from the internet
Pay attention to the third point. The Paperlesspaper app has to be able to reach your integration, so a service that only runs on your local network won't work. If you don't have a server, use the Vercel on click option below.
Step 1: Deploy the integration
You can run the integration in three ways.
Option A: Docker
If you run a server with docker already. simply start the prebuild Docker image:
docker run \
  --rm \
  -p 8080:4300 \
  ghcr.io/infinityofspace/paperlesspaper_open-meteo:latest
You can put it behind your existing reverse proxy. You should not add any kind of authentication in front, otherwise the Paperlesspaper app can not access your deployed integration.
Option B: One-click deploy with Vercel
This option needs no server of your own. Click the Vercel deploy link in the Readme, follow the steps, and Vercel gives you a public URL for your integration.
Option C: Node.js
With Node.js 20.6 or newer installed:
git clone https://github.com/infinityofspace/paperlesspaper_open-meteo.git
cd paperlesspaper_open-meteo
npm ci
npm run build
npm start
The server then runs on port 4300. You can change the port, host and proxy settings with environment variables, listed in the Readme.
Step 2: Connect it to Paperlesspaper
Open the Paperlesspaper web app and login in.
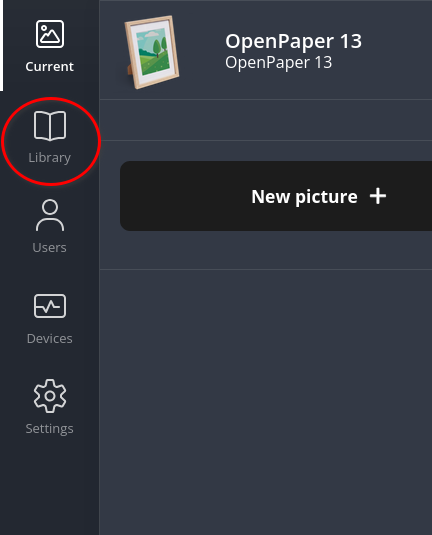
- Go to the Library tab and click New picture
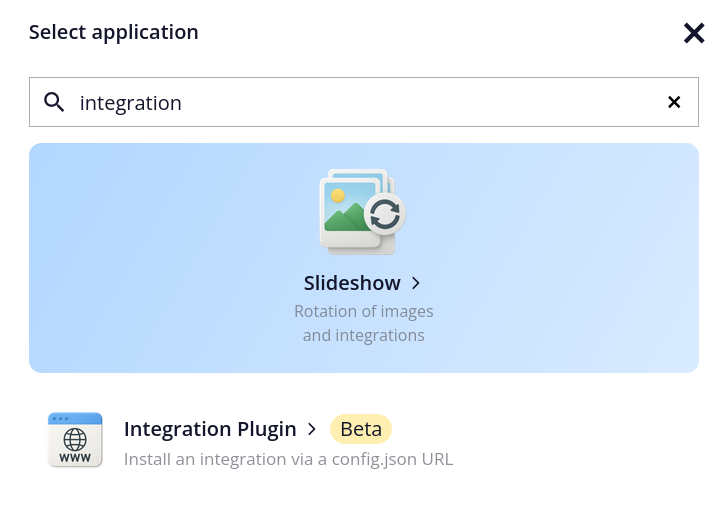
- Select Integration Plugin
- Enter the URL of your integrations's config.json, for example https://myserver.example.com/config.json
- Click Load integration
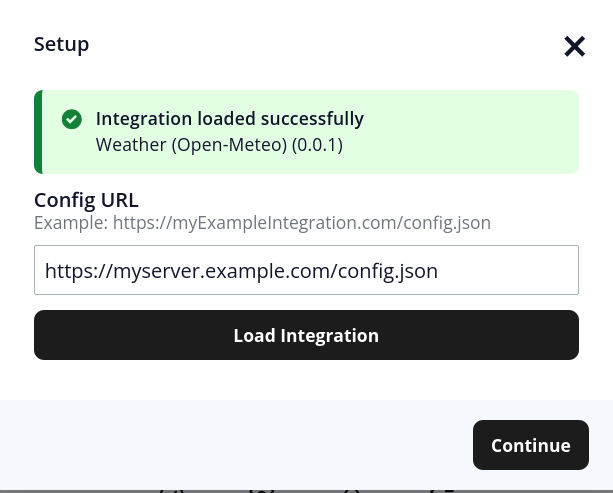
If everything works well, the setup window shows a "Integration loaded successfully" message. You are now ready to configure your weather data layout.
Step 3: Design your weather station
In the settings you pick your location, the number of rows and columns, and the content of each cell, starting with row 1, column 1.
Cell configuration
Each weather variable needs a prefix for its data source, the prefix and the data value is separated by a semicolon:
- current: for current value, e.g. current;temperature_2m
- minutely_15: for 15-minute forecasts charts, e.g.
- hourly: for hourly forecasts, e.g. hourly;precipitation_probability
- daily: for daily forecasts, e.g. daily;temperature_2m_max
Merging cells
You can merge cells next to each other by enter the same variable configuration to stretch a chart or tile across them. For example put daily;temperature_2m_mean in the row 2, column 1, row 2, column 2, row 3, column 1 and row 3, column 2 you get a chart spanning over two rows and columns.
Custom text, icons and special tiles
There are some special tiles, which can be used to customize the your layout:
- A cell can also be a static text. Add your own labels with the text Prefix, for example "text:Good morning".
- Weather icon of current weather conditions with "icon"
- Location name and coordinates of the selected location with "location"
- Current wind speed and direction with "wind"
- Current sunrise and sunset times in one cell "sun"
- Current min and max temperature of the day in one cell with "range"